MUN Impact has compiled, by SDG, each of the links for the Goals, Targets, Indicators and trackable data and progress towards those goals. We have put them on ONE page so that you can focus your research like a laser. Here’s a short guide to decipher the meaning behind these terms.
![]()
THE SDGs are a series of 17 goals to move all of us in the direction of being healthier, safer, more productive individuals, and in a way that protects our resources and planet for future generations. As an MUN delegate, these are the issues you research, write resolutions about, and ultimately DEBATE.
And you also know better than most that these are often profoundly difficult challenges, ones that take wide consensus and effort in order to ‘solve’. You see these same issues year in and year out at your conferences, meaning that there is no easy fix or simple solution to any of them. But that’s why they are part of the SDGs. The hope is that with time and collective effort, driven by data and policies and programs, the Goals will be met by 2030!
If you are not using the SDGs and the related targets, indicators and several other SDG tools to help you with your research you are missing a HUGE treasure trove of information, an probably not adequately addressing the issue in your resolution and policy statements. Here are three key terms and one incredible resource to get you started!
![]()
Goals: There are 17 Sustainable Development Goals. The can be roughly divided into people focused, environment focused and governance focused. They have super cool logos, and are becoming universally recognized around the world simply as ‘The Goals’.
Targets: Each Goal is broken down into targets, for a total of 169 spread across 17 goals. These targets provide the framework for the scope and breadth of each Goal, giving each one a manageable set of priorities to accomplish. The targets are interesting because they allow a more local, specific, and targeted lense through which to view each Goal.
Indicators: Indicators help measure if the targets are being met. In order to do this, a tremendous amount of data needs to be collected. The UN is good at collecting data, but finding a coherent, relatively straight forward way to track this data is challenging. Without the ability to collect and analyze data, there is no solid way to know if the targets are being met. And no way to know what else needs to be done. Two hundred and thirty two (232) indicators are used to gather data on the 169 Targets. By tracking these indicators, we can use data to determine if progress is being made towards the Goals.
Not surprisingly, coming up with even these targets and indicators was a long, and at times contentious, process. Some countries collect information on certain indicators, and others do not. There are 230 approved targets, but dozens more that have not been universally approved by all nations. Most indicators can be identified and tracked by data; a few cannot.
The Resolution adopted by the General Assembly on Work of the Statistical Commission pertaining to the 2030 Agenda for Sustainable Development is (A/RES/71/313).
![]()
SDG Tracker This website deserves the equivalent of the Nobel Prize in the MUN world. This incredible resource breaks down each SDG, dives into the indicators by target, and provides an incredible wealth of data to inform on the SDG in question. Its goal is to TRACK PROGRESS, so if you are researching an issue and want both up to date data and an understanding on how close the goal is to being met (and some context on why it isn’t), this will be a resource you will come back to again and again.
![]()
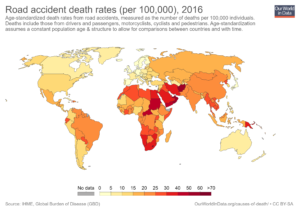
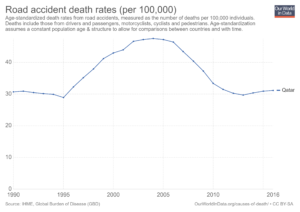
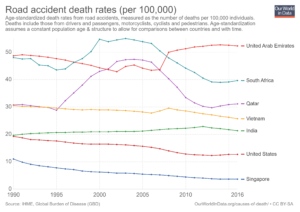
Using the SDG Tracker is simple, as our screenshots show. In exploring SDG 3, Good Health and Well-being you can dive into Target 3.6 : by 2020, halving the number of global deaths and injuries from road traffic accidents. You access data related to Target 3.6 by simply clicking on the world map. Using Qatar as an example, you can access road accident death rates for that country. You can also customize this graph by adding countries of your own choosing, as the comparative graph of the USA, Singapore, India, UAE and others show.
See our SDG page for more links and resources, organized by Goal.
